

When it comes to defining data literacy, it’s often narrowed down to the abilities of doing statistics and interpreting quantitative results – perhaps based on somewhat helpful visualizations. I tend to take a much broader view, probably due to my background in business intelligence and more than ten years of observations in various enterprises.
This time taught me a sometimes-frustrating lesson: even if people can understand analytic results, it doesn’t mean that they grasp how data is prepared and how painful the process – which I call data management – can be.
On the other hand, awareness of the issues around data management does not automatically come with an understanding of how to create or communicate analytical results to professional users, e.g. in business functions.
The five building blocks of the data literacy toolkit
Back in 2017, when I started to teach at Nuremberg’s Institute of Technology (TH Nürnberg), I researched the term data literacy and came across a very concise definition, summarized by David Crusoe as a result of his extensive literature review. This definition offers five different building blocks, which I like to generalize to two groups.
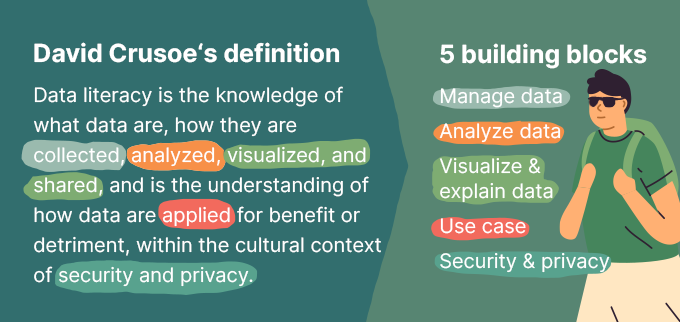
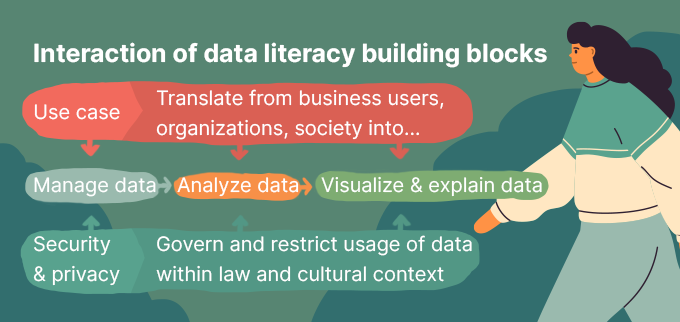
First, a core analytic process: managing data and translating various data sources via all kinds of analytics – broadly based on mathematics – to the presentation of results, often through a visual medium.
Second, this process has tight interdependencies to use cases, which justify the analytics process (i.e. why you’re doing the analytics), and to restrictions of security and privacy, which govern the analytics process.
In my courses I teach these five building blocks to students, telling them that they must have abilities in each – and should be especially aware of the connections and the effects that these blocks have on each other.
For illustration, let us use a topic we’re all familiar with. The COVID-19 pandemic. Within this topic environment, we first have to select our use case, which might be ‘breaking chains of infection’ – a major goal for society, and in Germany especially with regards to its public health service.
The complex task behind this goal requires a lot of digital support and data literacy has become one of the most required competencies in public health service in the last two years.
So, let’s move through the different building blocks the data literacy toolkit with this goal in mind.
Use cases
Tracking people and their behavior to identify hot spots, ordering persons who were in close contact with infected people to quarantine and managing all these processes are tasks that must be translated into data requirements and analytic requests, which will then need to be presented to decision-makers in government. To do so, we have to understand the processes and organizational structures underlying our use cases. Once we can abstract and model these, we will be able to translate them for the core analytics process steps.
Manage data
A lot of data is required to identify and manage people who have been in contact with those infected with COVID-19. From the data perspective we can differentiate data sources such as IT systems in COVID test centers, personal apps on mobile phones, and databases in health departments. Questions to ask include: on which aggregate level is data retrieved from these sources and how much integration of data sources is required to identify contact persons with a high certainty? Will this data be stored centrally or distributed? How close can we get to “real-time” in this scenario?
Remember, it won’t help if data on contact persons is available days after an identified infection, because the contact persons will probably have become ill in the meantime and further spread the virus. Consequently, fast reaction is essential but that requires more sophisticated technical infrastructure and specialized processes which retrieve data more regularly.
Analyze data
In my experience, more than half of what is called “analytics” tends to be sums and averages, or what we also recognize as pivotizing data: aggregate detailed data within groups such as time slices, regional groupings etc. All of these will be essential for our COVID-19 sample, too.
We have to analyze the development of infections, the local distribution over certain districts, cities or regions and we will calculate normalized values, such as ‘daily infections per million inhabitants’. But there is a lot more to this process step. Can we forecast developments based on certain factors? Is the correlation we find due to causation? What kind of machine learning algorithms can help us to gain insight from user forums, citizens’ hotlines etc?

Visualize, interact, explain data
Once we have all these sophisticated analytical results, it does not necessarily mean that we consider these the final results. We must present our results in a way that allows the target group to parse them. The audience makes a huge difference to this. One might be an individual being warned of a possibly critical contact she or he has had. Another might be the politicians and health departments who must decide daily were to focus activities, how to allocate resources and what rules to implement.
Information design and storytelling are some of the key capabilities required. But knowledge about technical aspects of the communication channels (i.e. mobile app or conference presentation) are also needed to adequately present and market the results.
Remember: if you stumble within this step, all preceding activities could be rendered worthless.
Security & privacy
Until now we’ve worked under the assumption of a perfect world with well-meaning actors and societies. However, in the real-world we have to secure our data process against intruders and subjects who want to abuse the information gathered and created.
That means our data literacy toolkit must include knowledge about security mechanisms. This is not only about defining roles and granting permissions. It can also be about whether information is stored centrally or in a dispersed manner – as discussions about the German Corona Warning App showed in 2020. Such decisions result in different vulnerability scenarios.
Furthermore, depending on cultures and political systems, the value of privacy and the right to govern what happens with our individual data is an increasingly important factor that touches on basic human rights (e.g. of non-discrimination) and on our ideas of freedom. For example, the question of whether an individual is free to go and meet with people without organizations recording this information clashes to some degree with the needs of our use case – breaking the chains of infection.
If we neglected these topics we would refuse to take responsibility for the impact a databased analytical system can have on businesses, customers, citizens and societies.
Building the data literacy toolkit
Naturally, not every person aspiring to become data literate will be a master in all of these five fields, but as the definition states: sometimes sound understanding and basic background knowledge is already sufficient while at the same time becoming a master in just a few of those areas will give you a competitive edge in your personal career environment.
About the author
Professor Dr. Roland Zimmermann is a lecturer of Business informatics and statistics at the Technical University of Nuremberg. He teaches data literacy, business intelligence and information design as well as applied artificial intelligence. His current research focus is on natural language processing and knowledge graphs and for technology and innovation management.